1° Color Morphology Analysis |
In the first phase of the analysis, the image colors are analysed and quantified. It is used to differentiate objects from their background. Debris can be filtered out by different methods (see table below). In the second analysis phase, measurements are made on the detected objects and the whole image (or analysed region of it). These fall into three categories.
- 1) Global measurements related to the analysed region such as total and percentage area occupied by objects and their average morphological measurements (area, length, width...). Color aggregation is also in this group.
- 2) Individual morphological measurements such as area, length, width, perimeter and form coefficient.
- 3) Area in function of color, NDVI or Color Index. For each object and the analysed region, you get the area occupied by colors of interest and groups of them. This also includes information about the dominant color. Objects can also be classified based on color content in function of criteria that you choose.
| The histogram above the image can display the area per color class or group and the objects’ frequency distribution in function of a morphological measurement (Ex: number of objects of a certain area or length range). |
|
|
|
|
A 24 bits color image to be analysed. It can contain millions of colors. Such images are easily obtained with digital cameras and scanners. |
Before analysing images, you must teach WinCAM which colors are part of the objects (grass, fruits, disease or healthy regions) and which ones are the background (soil) simply by clicking them in the image and giving names to these clusters that we call “color classes”. In the first phase of the analysis, WinCAM classifies the image pixels into one of these classes. The result of this classification can be displayed and saved to files. |
Color classes can be grouped. The group can be given a name and area measurements data can be obtained per color class or group. In the above example, the Grass group is made of four green colors and the soil two brown colors.
The classification into groups can also be displayed and saved to files. There can be up to three groups and each one can have up to twelve color classes. |
Example of color classes to analyse the soil cover image to the left. |
| Pixels are classified as a function of their color (Hue, Saturation and Intensity which is equivalent to Hue, Value and Chroma used in the Munsell color classification system). A tolerance factor for each of these component allow to include more or less colors in each class. |
| |
| |
|
|
 |
 |
 |
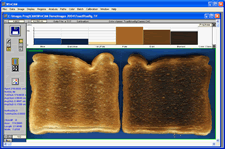
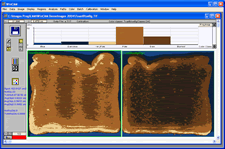
WinCAM NDVI can be used to quantify toasts (slices of bread) baking uniformity. |
The image of colour classes. It shows into which color class each pixel has been classified. |
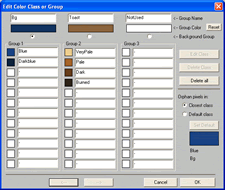
Colour classes and groups defined
to analyse the toasts baking. |
Note: You can get interactive information about analysed objects by clicking them in the image or look at the data files for more details. Measurements data are saved in text files that can be read by many programs (like Excel).
When you classify soils or plants by comparing their color to a printed set of reference colors such as the Munsell Soil Color Charts or Munsell Plant Tissue Color Chart, you are doing what we call an absolute classification. When you classify plant colors without comparison to an external reference, simply by comparing them you are doing what we call a relative color analysis. WinCAM NDVI works in the latter way. It classifies colors on a relative basis of what is contained in an image. It is possible in WinCAM NDVI to emulate an absolute color analysis by including in each image some reference colors (such as a subset of the Munsell samples). In that case, colors of the objects to analyse are compared to these reference color samples. This will work for as long as the number of reference color samples does not exceed WinCAM NDVI's limit of 36. |
2° Spectral Vegetation Index Analysis (NDVI, Greenness) |
WinCAM NDVI can compute six vegetation indices frequently used in agriculture and forestry healthiness/stress assessment (NDVI, ENDVI, EVI2, MSAVI, WDRVI, Green Chlorophyll) and you can also define you owns.
- The NDVI (Normalized Difference Vegetation Index) is one of those pre-defined spectral indices. It is a measure of plant healthiness and quantity. It is computed from images which have NIR (Near InfraRed) data in one of its channel and Visible data (blue or red) in another. Such images can come from aerial or ground based multi-spectral cameras. The index highlight the strong reflectance of healthy green plants in the NIR (due to mesophyl cells scattering light at that wavelength) compared to the low reflectance in the Visible (due to the chlorophyll high absorption). Dry or inactive vegetation, soil, rocks and water do not exhibit this spectral behavior. NDVI images and data can be analysed interactively or in batch (without operator supervision) from multispectral images stored in a folder. |
|
|
|
This image was acquired with a conventional color camera |
|
This image was acquired with a NDVI camera. Its Red channel contains the NIR data while the Blue one contains the visible Blue channel data. |
|
|
|
This image displays the NDVI data using a gray scale (white = high NDVI value, Black = negative values). It was produced in WinCAM from the above row NDVI camera image. |
|
This image (and the two below) displays the NDVI data using 3 different (false) color schemes. It was produced in WinCAM from the left NDVI camera image. |
|
|
|
These images display the NDVI data using 3 different (false) color schemes. It was produced in WinCAM from the above NDVI camera image. |
|
| |
- You can also can define your own Spectral (color) index as a mix of an image RGB (Red, Green or Blue) or HIS (Hue, Saturation, Intensity) channels or the ratio of two such mixes. The Greenness is an example of a custom spectral index you can define. It quantifies the amount of green in a standard color image. It is an index which has positive values when green is present and zero or negative when it is not. It is frequently used in soil vegetation cover analysis. Spectral (color) indices images and data can also be analysed interactively or in batch (without operator supervision).
WinCAM NDVI can compute the spectral indices for the whole image, a region of it or per objects. It can also use the index values to classify them on different accept/reject criteria. Index data are available for these 3 types of analysis on screen and in data files (text based) and is also available in visual form as an index image with gray levels representing the index strength. These images can be saved for analysis or imported in different programs for multiple purposes (generate reports,...).
|
3° Profilometry |
WinCAM NDVI can be used as a profilometer to analyse the gray levels (light intensities) or color variations along paths drawn by the operator over the image. Gray levels profiles can be saved in data files while color profiles’ data are saved as a summary of their color content (length in units and percentage of total path length per color). The profilometer can also be used to manually or semi-automatically measure objects dimensions by clicking them in the image.
|
4° Reflectance and Color Balance Calibration |
It is possible to calibrate WinCAM NDVI so that it makes measurements in reflectance values or simply to balance the color channels. The former is done using known reflectance multi steps targets and the latter with a single white object. Both are available for the Visible and NIR spectrum. Calibration against know standards allows you to compare analysis data between images acquired with different cameras or camera settings (thus different lighting intensities for the same reflectance).
|
5° Its ability
to analyse individual objects
|
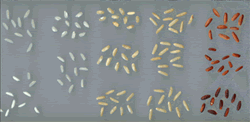
WinCAM NDVI has the ability to analyse individual objects such as rice kernels (to measure their morphology, classify them in function of color or quantify the colors distribution per kernel).
The analysis of soil covered by plant,s as illustrated at 1° in the introduction. There are no objects to analyse in such images (only the classification of pixels into groups such as healthy vegetation, diseased vegetation and soil). |
 |
| |
|
|
WinCAM NDVI detailed features & measurements
|
|
Basic |
Reg |
Pro |
|
| Global (total) analysis |
√ |
√ |
√ |
Measurements applies to the whole image or analysed region (not to individual objects). |
| Projected area |
√ |
√ |
√ |
Objects area projected on a 2D plan (the scanner glass). |
| Color Analysis (area per color) |
√ |
√ |
√ |
Area quantification per color (for disease, soil cover, healthyness…. quantification). |
| Color Aggregation |
|
√ |
√ |
How colors are regrouped or distributed within objects or regions. |
| Global NDVI & Color Index Analyses |
|
√ |
√ |
For the image or analysed region. 6 pre-defined indices, 4 customs. |
| Profilometer & Interactive and semi-automatic length & color |
|
√ |
√ |
User trace lines over the image, length and color measurements are done accros those line, with the option of considering objects intersected. |
| Individual objects analysis |
|
|
√ |
Automatically detect objects based on different criteria (grey levels, color, NDVI…) and make measurements (see below) on them. |
| Automatic objects count |
|
|
√ |
The number of valid objects in the analysed region. |
| Length & Width |
|
|
√ |
4 different methods to measure object's length and width. |
| Perimeter |
|
|
√ |
Objects perimeter measured on the 2D projected area on the scanner glass. |
| Form Coefficient (Individual & average) |
|
√ |
√ |
Objects form coefficient measured on the 2D projected area on the scanner glass. It is a numerical value which grade the leaf shape between circular (shortest perimeter for a given area) and filliform (longest perimeter for a given area). |
| Manual objects counter |
|
|
√ |
To manually count objects by clicking them. |
| Length/Width ratio |
|
|
√ |
Ratio of objetcs' length to width. |
| Position |
|
|
√ |
Objects' position in the image. |
| Objects color classification |
|
|
√ |
Classify objects into groups based on areas of colors present on them (using different adjustable criteria). |
| Objects Spectral index |
|
|
√ |
6 pre-defined indices, 4 customs. |
Features, |
Basic |
Reg |
Pro |
|
| Color measurements visible over the images |
√ |
√ |
√ |
Image pixels color class or group classification drawn over them. |
| Histogram of color areas distribution |
√ |
√ |
√ |
Display areas distribution in function of color. |
| Rectangular Analysed and Exclusion Regions |
√ |
√ |
√ |
Choose the region of the image to analyse or exclude it (rectangular form). |
| Circular and Free Style Analysed and Exclusion Regions |
|
√ |
√ |
Choose the region of the image to analyse or exclude it (circular or irregular shape). |
| Pre-defined set of analysed regions vertically |
|
√ |
√ |
Automatically create analysed regions at specific vertical positions in the image. |
| Batch analysis |
|
√ |
√ |
Analyse images in lots without operator supervision. |
| Image edition |
|
√ |
√ |
Removes artefacts, debris or defects. Can also be used to override the objects and background classification. |
| Multiple documents |
|
√ |
√ |
Analyse up to 16 samples simultaneously in different WinCAM's main window. |
| Reflectance Calibration |
|
√ |
√ |
To get measurements data in function of light intensity or reflectance from objects. |
| Automatic Background detection based on color |
|
√ |
√ |
For color images acquired with a camera when background doesn't cover the whole image. |
| Histogram of objects distribution |
|
|
√ |
Displays objects distribution in function of different morphological data (area, length, width…). |
| Morphological measurements visible over the images |
|
|
√ |
Lines indicates where and how length, width, perimeter… were measured. |
| Objects Color classification visible over the images |
|
|
√ |
Based on relative areas of colors present in the object (different user adjustable criteria) |
| Defects and debris automatic filtering |
|
|
√ |
Based on different criteria (area, morphology and color). |
| Manual objects rejection |
|
|
√ |
By clicking them in the image. |

