|
| Measurements | Basic |
Reg |
Pro |
Description |
| Cell count | √ |
√ |
√ |
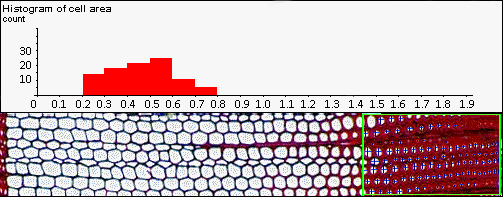
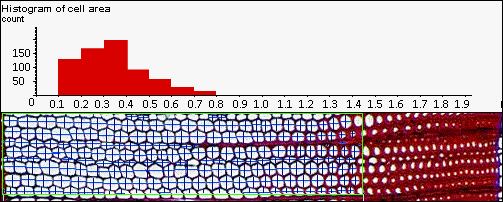
The number of valid cells in the analysed region. |
| Area (Total, Average & Individual) | √ |
√ |
√ |
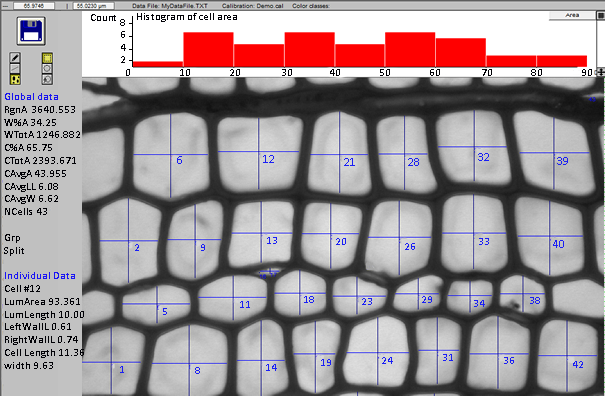
Lumen area. |
| Length, Width & Length/Width ratio (Individual & average) | √ |
√ |
√ |
4 different methods to measure object's length and width. |
| Perimeter & Form Coefficient (Individual & average) | √ |
√ |
√ |
Lumen perimeter and form coefficient (a numerical value which grade the leaf shape between circular (shortest perimeter for a given area) and filliform (longest perimeter for a given area)). |
| Position | √ |
√ |
√ |
Lumen's position in the image. |
| Interactive measurements to measure lumen and walls at specific places | √ |
√ |
√ |
Measures lumen & walls on paths traced interactively. |
| Manual cells/objects counter | √ |
√ |
√ |
Manually count cells/objects by clicking them. |
| Ring analysis | √ |
√ |
Morphological cells measurements on a ring basis (requires high resolution images of whole rings). | |
| Color analysis | √ |
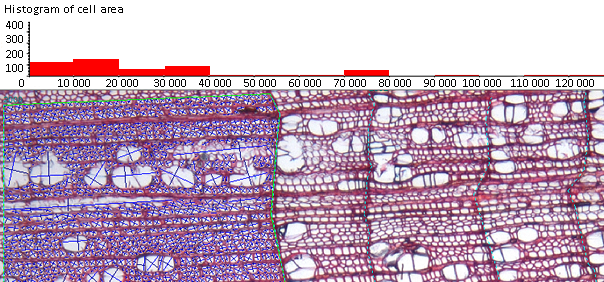
For lument & walls detection & Area quantification per color. | ||


